金钱 金钱- 2052
 魅力 魅力- 20
 威望 威望- 3896
- 积分
- 3942
- 精华
- 13
- 帖子
- 2969


|
独立报 2010年英国大学排名
The Complete University Guide: University League Table 2010 : Sheet1
Rank 2010 Rank 2009 Institution Student Satisfaction Research Assessment Entry Standards Student Staff Ratio Academic Services Spend Facilities Spend Good Honours Graduate Prospects Completion Score
.
Maximum Scores 5 4 N/A N/A N/A N/A 100 100 100 1000
.
1 -1 Oxford 4.11 3 524 10.9 2639 587 91.1 82.3 97.6 1000
.
2 -2 Cambridge 4.18 3 539 11.6 1755 657 87 85.5 99 947
.
3 -3 Imperial College 3.69 2.9 489 10.3 3036 575 68.5 88.4 97.1 910
.
4 -3 London School of Economics 3.77 3 483 14.1 1391 265 76 90.6 96.5 853
.
5 -6 Durham 3.96 2.7 459 15.2 1036 682 77.5 78.3 96.7 819
.
6 -5 Warwick 3.9 2.8 463 13.5 1630 354 79.7 79.2 95.9 817
.
7 -7 St Andrews 4.22 2.7 468 12.3 1152 357 85.1 77.8 94.2 801
.
8 -8 University College London 3.85 2.8 452 9.1 1586 220 80.4 82.9 92 793
.
9 -14 Bath 3.9 2.7 440 15.3 960 424 75.1 81.9 95.6 765
.
10 -11 York 3.96 2.8 434 13.4 1246 369 74.9 69.4 95.9 764
.
11 -21 Edinburgh> 3.66 2.7 447 12.8 1660 335 80.6 76.9 90.4 756
.
12 -10 Lancaster 3.92 2.7 388 13.7 1036 488 69.6 64.3 93.3 749
.
13 -20 Southampton><# 3.81 2.7 407 14 1154 449 74.6 76.5 93.7 739
.
13 -23 Aston 4.02 2.4 365 16.6 895 675 63.6 78.1 91 739
.
15 -9 SOAS 3.82 2.6 378 10.7 1520 253 73.2 73.5 82.5 735
.
16 -16 Bristol 3.72 2.7 447 13.3 1386 307 81.5 82 95.7 734
.
17 -15 King's College London 3.74 2.7 415 11.6 1589 320 72.8 83.2 92.3 724
.
18 -13 Loughborough 4.13 2.6 368 17.3 744 496 67.7 75.7 91.4 720
.
19 -16 Nottingham 3.79 2.7 408 13.8 972 392 74.3 76.3 95.7 713
.
20 -12 Leicester 4.13 2.5 360 14.8 970 460 71.6 76.2 93 706
.
21 -19 Exeter> 4.15 2.6 394 17.6 987 384 79.4 71.7 91.5 704
.
22 -26 Sheffield 3.88 2.7 406 14.5 969 354 74.5 79.1 92.2 703
.
22 -22 Royal Holloway 3.89 2.7 365 14.6 868 389 70.3 69.8 92.9 703
.
24 -27 Newcastle 3.84 2.6 405 14.9 1097 398 72.2 79.4 92.3 700
.
25 -29 Sussex 3.88 2.6 378 15.6 785 333 81.7 70.6 90.1 697
.
26 -16 Glasgow< 3.88 2.6 412 13.5 933 511 71.3 75.4 86.7 693
.
27 -24 Birmingham 3.89 2.6 403 15.3 1216 401 70.9 72.7 93.7 689
.
28 -27 Manchester 3.67 2.8 412 14.7 1136 362 70.4 73.8 91.6 685
.
28 -32 Leeds 3.82 2.7 392 14.4 851 385 73.4 71.1 91.9 685
.
30 -25 Essex 3.87 2.8 302 13.8 1050 413 61 62.7 87.4 671
.
31 -30 Surrey 3.8 2.6 352 17 858 347 65.1 80 88.8 653
.
32 -33 East Anglia 4.08 2.6 361 17.1 866 401 70.1 71.9 85.5 651
.
33 -34 Queen's, Belfast 3.8 2.6 358 15.3 905 511 69 78.3 85 648
.
34 -42 Liverpool 3.77 2.5 387 12.3 1196 285 68.8 72.5 91.2 647
.
35 -38 Reading 3.91 2.5 347 16.6 709 343 75.4 68.7 91.7 646
.
36 -37 Cardiff 3.75 2.7 394 14.9 927 253 66.8 77.6 92.5 645
.
37 -44 Goldsmiths College 3.79 2.6 318 12.8 641 178 65.2 69 85.6 635
.
38 -35 Kent 4 2.6 317 17 733 312 61.7 71.8 87.8 624
.
39 -49 Heriot-Watt 3.8 2.5 350 15.8 832 391 65.5 76.2 80.3 618
.
40 -31 Strathclyde# 3.73 2.5 393 19.2 1118 254 74 78.1 83.2 615
.
41 -41 Brunel 3.74 2.3 319 17.5 1080 423 64.9 67.9 86.3 612
.
42 -40 Keele 3.92 2.4 319 14.5 808 331 64.4 70.4 89.1 611
.
43 -43 Queen Mary 3.82 2.7 346 13.4 878 338 64.2 77.3 88.5 609
.
44 -46 City 3.77 2.5 316 17.9 776 305 66.6 81.4 84.3 599
.
45 -54 Hertfordshire< 3.71 2.4 244 15 822 850 47.3 65.3 82.3 597
.
46 -52 Nottingham Trent~< 3.81 2.2 276 16.6 795 399 55.7 74.1 86.2 592
.
47 -39 Aberdeen 3.97 2.6 363 15.1 929 224 67.6 74.4 77.3 590
.
48 -35 Stirling*@ 3.82 2.4 324 14.3 873 153 64.3 69.8 81.4 589
.
49 -52 Dundee> 3.84 2.5 371 14.9 935 262 65.8 75.6 71.3 574
.
50 -61 Robert Gordon* 3.82 2.1 332 18.2 913 288 53.2 84.1 81.8 569
.
51 -51 Ulster 3.74 2.5 268 16.2 1160 356 61.4 65 77.4 568
.
52 -48 Hull 4 2.4 285 19 799 281 57.7 73.2 87 566
.
53 -59 Oxford Brookes 3.83 2.2 301 18.7 648 380 66.1 73 83.8 565
.
54 -56 Bournemouth 3.79 2.2 289 21.2 896 233 57.2 75.5 85.1 558
.
55 -45 Aberystwyth 4 2.5 310 17.7 746 364 61.1 53 87.5 548
.
56 -47 Swansea 3.88 2.4 304 15 778 303 50.3 62.5 87.4 536
.
57 -49 Bradford 3.73 2.3 270 15 830 279 62.8 70.4 82.4 535
.
58 -73 Northumbria~> 3.91 2.1 291 17.7 787 271 54.1 73 80.3 534
.
59 -69 Birmingham City~ 3.71 2.3 258 17.6 827 519 57.3 65.7 75.4 533
.
60 -56 University of the Arts, London 3.47 2.5 322 22.1 687 90 61.6 63.6 85.5 523
.
61 -66 West of England, Bristol 3.86 2.2 275 19.3 696 328 63.2 66.1 78.8 512
.
62 -60 Portsmouth 3.94 2.2 271 19 917 265 52.4 63.9 86.1 510
.
63 -67 Brighton> 3.79 2.4 278 19.8 579 239 58.5 65.3 84.7 506
.
63 -55 Bangor># 3.85 2.4 283 19.2 751 200 55.7 67.8 83.8 506
.
65 -65 UWIC, Cardiff 3.85 1.9 261 20.1 798 461 51.8 61.5 83.2 498
.
65 -64 De Montfort 3.92 2.3 248 17.2 731 232 51.1 65.7 81.5 498
.
67 -71 Chichester 4.04 2 234 18.8 567 377 49.3 64 89.2 491
.
68 -80 Sheffield Hallam 3.72 2 268 18.9 735 239 61.3 64.2 83.8 490
.
69 -74 Winchester 3.86 2.2 261 17.5 588 271 55.7 55.6 85.6 482
.
70 #N/A University for the Creative Arts 3.55 2.3 247 24.9 1167 284 51.2 58.2 85.3 480
.
71 -58 Gloucestershire 3.79 1.7 239 18.7 886 354 56.2 64.2 82.1 478
.
72 -85 Bedfordshire 3.81 2.1 215 15.7 662 426 47.8 66.7 75.1 474
.
72 -77 Edinburgh Napier* 3.82 1.8 291 18.3 780 154 62.4 72.9 72.7 474
.
74 -96 Glasgow Caledonian 3.8 2 328 21.8 814 159 66.5 68.8 76.8 473
.
75 -70 Plymouth} 3.78 2.2 268 15.9 787 251 61.4 58 84.2 468
.
76 -71 Salford 3.74 2.4 253 18.8 725 300 55.1 62.7 76.5 463
.
77 -101 Lampeter 3.99 2.1 252 15.5 658 149 52.8 61.8 82.7 460
.
78 -99 Lincoln~>#§} 3.88 1.9 266 22.9 724 228 57.1 60.4 85.1 457
.
79 -63 Central Lancashire># 3.84 2 252 20.2 826 361 49.3 70.1 72.8 456
.
80 -80 Staffordshire 3.81 1.6 232 17.9 897 311 53 69 78.1 455
.
81 -89 Kingston 3.83 2 236 19.4 723 310 60.1 61 79.3 454
.
82 -88 Manchester Metropolitan 3.65 2.2 266 19.9 779 242 57.2 63.8 79 448
.
82 -76 Bath Spa 3.92 1.9 287 24 418 133 67.7 59 87.1 448
.
84 -105 Huddersfield^< 3.77 2.1 265 16.3 671 205 51.9 56.9 81.2 447
.
85 -84 Coventry 3.69 1.9 280 20.8 798 294 61 67.5 75.2 445
.
86 -75 Queen Margaret* 3.82 1.4 328 20.7 833 111 65.3 69.2 78.6 441
.
87 -77 Roehampton<^ 3.65 2.2 251 18.9 1049 215 51 56.8 78.5 439
.
88 -82 Middlesex 3.72 2.2 194 24.1 1476 442 50.8 64.4 64.7 433
.
89 -92 Westminster 3.64 2.2 249 16.5 581 237 51.5 54.1 77.5 427
.
90 -90 Chester 3.8 1.7 267 19.3 534 210 54.8 65.1 78.2 422
.
91 -97 York St John 3.84 1.4 288 20.3 875 299 52.9 58.8 84.4 415
.
92 -102 Teesside 3.88 2 257 19.9 668 196 52.4 67.3 72.7 411
.
93 -79 Sunderland 3.93 1.9 226 17.1 554 311 50.2 59.3 75.7 410
.
94 -86 Glamorgan 3.75 2 263 18 701 202 52.4 60.4 69.1 409
.
95 -68 Abertay Dundee* 3.82 1.8 279 20.5 1260 246 48.3 53.3 70.1 399
.
96 -93 Worcester 3.88 1.5 236 20.3 708 165 48.4 68.2 83.9 398
.
97 -98 Leeds Metropolitan 3.54 2.1 257 23.1 825 120 53 59.9 82 397
.
98 -110 Thames Valley> 3.76 1.7 197 16.8 878 432 50.4 59.7 63.6 395
.
98 -83 University of Wales, Newport 3.8 2.4 229 26.4 530 304 54.8 55.8 72 395
.
100 #N/A Glyndwr 3.83 1.7 212 20 776 345 50.6 69.3 70.1 394
.
101 -103 Derby 3.75 2 231 19.2 1073 251 46.6 54.9 76.5 392
.
102 -107 Wolverhampton 3.7 2 204 19.2 800 419 44.6 60.9 73.4 391
.
103 -86 Buckinghamshire New 3.64 1.7 210 20.4 550 633 46.3 50.9 79.7 388
.
104 -100 Liverpool John Moores 3.72 2.2 244 19.7 790 212 45.7 58.8 76.2 387
.
104 -93 Northampton 3.83 1.7 233 20.8 693 209 53.7 59.5 81.4 387
.
106 -105 East London 3.63 2.2 191 22.7 725 404 44.4 62.7 71.6 371
.
107 -90 Canterbury Christ Church 3.8 1.8 238 19.1 537 148 49.7 59 80.3 358
.
108 -104 Cumbria 3.71 1.2 256 31.7 496 181 48.8 71.4 84.6 347
.
109 -107 Edge Hill 3.84 1.5 248 19.9 928 160 46.1 56.8 79.2 344
.
110 -95 Southampton Solent 3.58 1.5 211 21.6 699 351 45.7 56.6 74.5 337
.
111 -111 Greenwich 3.91 1.9 212 23.1 619 219 44.9 59.6 75.8 333
.
112 -112 Bolton 3.77 1.7 213 19.4 392 328 53.5 59.1 56 307
.
113 -113 London South Bank 3.63 2.2 179 27.9 652 149 53.7 63.2 69.4 280
.
.
Mean 3.82 2.28 313.71 17.49 919.33 325.59 61.56 68.63 83.63
.
Max 4.22 2.98 538.54 31.67 3036.36 849.84 91.07 90.6 99.05 1000
.
Min 3.47 1.23 178.58 9.12 392.15 90.1 44.42 50.95 56 280
From: http://www.independent.co.uk/new ... -xhtml-1675616.html |
|


 发表于 2008-10-1 14:48

 发表于 2008-10-1 15:28

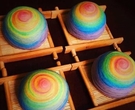 Mei - 中式点心 彩虹旋酥
 分享一下我的美虐烘焙路